1. From Scroll, on the dire straits of health care and school education in Bihar,
Seventy years after Independence, the state’s healthcare infrastructure continues to be grossly inadequate. Seventeen of the 38 districts in the state have no more than three government doctors for every 100,000 people. One district, Siwan, has just one doctor for 100,000 people. The highest, Sheikhpura, has eight doctors per 100,000 – or one for every 12,500 people. To put that in perspective, the WHO-prescribed level is 1:1,000. In the same way, while the Right To Education law mandates student-teacher ratios at 30:1 in primary schools and 35:1 in upper primary, the ratio in Bihar districts hovers between 43:1 and 96:1.
This is a nice exploration of why Bihar has remained so grossly under-developed.
2. Job losses from trade, off-shoring, technological changes or automation assume grave proportions when they are concentrated. Sample this from David Author and Co's study on the China effect on the US economy,
When China joined the World Trade Organization in 2001, there were fewer than 400,000 people working in American textile mills. As a proportion of the 150m-strong workforce, they were a tiny sliver. But in 57 counties in the south east of the country, they accounted for more than 15 per cent of all jobs. The impact of Chinese competition in these places, says Prof Autor, was “like a mini economic bomb going off over downtown”. His research found the people who lost their jobs went on to suffer more job churn and lower lifetime incomes. Poverty rose. More men started to die from drugs and alcohol. The economic ripples from the loss of manufacturing jobs hit other local businesses.
3. Is Switzerland the best health care system in the world? Read this very informative Upshot analysis. The description of Swiss system,
Like every country here except the U.S., Switzerland has a universal health care system, requiring all to buy insurance. The plans resemble those in the United States under the Affordable Care Act: offered by private insurance companies, community rated and guaranteed-issue, with prices varying by things like breadth of network, size of deductible and ease of seeing a specialist. Almost 30 percent of people get subsidies offsetting the cost of premiums, on a sliding scale pegged to income. Although these plans are offered on a nonprofit basis, insurers can also offer coverage on a for-profit basis, providing additional services and more choice in hospitals. For these voluntary plans, insurance companies may vary benefits and premiums; they also can deny coverage to people with chronic conditions. Most doctors work on a national fee-for-service scale, and patients have considerable choice of doctors, unless they've selected a managed-care plan.
Noah Smith thinks Japan offers the highest quality at the lowest cost, despite having the burden of the the oldest population. He describes the Japanese system,
The government pays 70 percent of the cost of all health procedures, unless you’re a low-income elderly resident, in which case it pays as much as 90 percent. The remaining 30 percent is covered by private health insurance -- either employer-sponsored or privately purchased -- which citizens are required by law to have. Spending on private health insurance to cover the 30 percent co-pay is partially tax-deductible. Benefits are the same for everyone, and -- unlike many U.S. health plans -- include dental and mental-health care. For catastrophic care, poor people, and people with disabilities or certain chronic conditions, the government pays more... In Japan, fees for health services are capped by a government committee.
4. Robert Shiller tweets this graphic capturing the exuberant valuations in US equity markets,

On the valuations, as reflected in the ten-year lagged cyclically adjusted price to earnings ratio (CAPE), he writes,
The C.A.P.E. ratio is above 30 today, compared with an average of 16.8 since 1881. It has been above 30 in only two other periods: in 1929, when it reached 33, and between 1997 and 2002, when it soared as high as 44. The current number is troubling. After the ratio’s peak in 1929, real inflation-corrected stock prices in the United States lost four-fifths of their value by 1932, the biggest crash in the market’s history. And from 2000 to 2003, they lost half of their real value.
But he acknowledges that unlike those two past episodes, investors and financial market opinion makers appear remarkably calm now despite the inflated valuations.
5. From a nice article by Kshitij Batra and Ohan Shridhar sounding a cautionary note on the effects of the Real Estate Regulation Authority in India,
Currently, constructing residential housing in Indian cities requires a costly array of clearances from different government authorities at the central, state and local levels. These approvals can take between 12-18 months, in other cases longer, where a single department or official could block a file and stall an entire project. Under these circumstances, developers in many cases are unable to meet the timelines agreed to with the buyers not as a result of their malfeasance, but due to a failure of efficient government coordination. Moreover, the uncertainty about the time schedule for approvals also raises the risk-adjusted costs of capital for project financing. Rera in its present format imposes mandatory obligations on builders to abide by a previously agreed to time schedule, without enforcing these same obligations on governmental agencies responsible for project clearances. The costs of penalties, refunds and interest payments thus borne through hamstrung state capacity by developers will then ultimately be paid by consumers in the form of higher prices, without fundamentally increasing housing supply.
I have blogged earlier and am in agreement with the concern. But an alternative narrative could be that reforms like RERA (and the legal obligations that come with it) provides the political cover for well-meaning government bureaucracies in at least a few states to streamline and crackdown on the inefficiencies and weaknesses in local government buildings approval processes.
6. Good article by Sujatha Rao on the controversy surrounding the standardised National Eligibility Entrance Test (NEET) for medical college admissions. For several reasons, I have reservations on a nationwide entrance examination for India and would prefer more flexibility to states, even with all its ill-effects. The concerns of good colleges like CMC Vellore are well-founded,
Like in the UK, over the years, they have “perfected” the admission policy to look beyond marks and assess students’ commitment and value systems through a process-based interview — a system that government should adopt as well, including for recruiting IAS officers. The NEET is clearly a regressive policy in so far as such colleges are concerned.
The solution, as also suggested by Sujatha Rao, is to have a stricter licensing examination,
Given our commitment to cooperative federalism, allow states to have their own admission policies but make an All India Licence Examination for registration with the MCI mandatory for those wanting to study or practise in other states or go abroad (on the logic that states have an obligation to fulfill the minimum criteria that is acceptable to all if their doctors seek to treat patients of other states), alongside instituting the National Exit Examination.
After they complete their coursework, let students be allowed the freedom to either take the All India Examination or the respective state government examination.
7. The graphic below captures how oil price lottery that the government has enjoyed, which has singularly been responsible for the government meeting the fiscal deficit target.
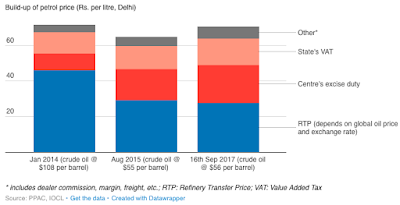 As the report says, the central government has raised the excise duty on petrol and diesel nine times since November 2014, boosting tax revenues from petrol and diesel from 0.44% of GDP in 2013-14 to 1.44% of GDP in 2016-17. In the same period, fiscal deficit fell from 4.5% to 3.5% of GDP!
8. Interesting point that India has been a relative laggard in lowering poverty, in terms of GDP growth elasticity of poverty reduction, compared to even countries like Brazil and Mexico,
7. The graphic below captures how oil price lottery that the government has enjoyed, which has singularly been responsible for the government meeting the fiscal deficit target.

8. Interesting point that India has been a relative laggard in lowering poverty, in terms of GDP growth elasticity of poverty reduction, compared to even countries like Brazil and Mexico,
India extricated 120 million people from extreme poverty between 1990 and 2013. However, this process was relatively slow. Over the same period, China reduced the number of people living in extreme poverty from 756 million to 25 million. If we factor in economic growth, between 1995 and 2012, the growth elasticity of poverty reduction for India is just over 0.12. By contrast, countries such as Brazil, Mexico, Ecuador, and Thailand — that witnessed relatively low economic growth rates — emerge as positive outliers, exhibiting higher growth elasticities of poverty reduction than many high-growth countries, including India. While the growth elasticity of poverty reduction for China is a little over 0.28, the numbers for Mexico and Brazil are 3.28 and 1.14 respectively.
No comments:
Post a Comment