Substack

Monday, April 22, 2024

The balance sheet of UK's water and sewage privatisation

It’s no hyperbole to argue that the UK water sector privatisation could be described as the Great British PPP Robbery. It may well become the canonical example of the problems with the privatisation of regulated utilities. 

Consider the latest balance sheet of the water sector in UK. 

Water companies in England and Wales paid £2.5bn in dividends and added £8.2bn to their net debt in the two financial years since 2021, according to research by the Financial Times. The updated figures mean that the 16 water monopolies have paid out a total of £78bn in dividends in the 32 years between privatisation in 1991 to March 2023, according to the research, which is based on regulatory data and then adjusted for inflation. The £78bn payout is nearly half the £190bn the companies spent in the same three decades on infrastructure. The utilities meanwhile chalked up more than £64bn net in debt over the same period, despite being sold at privatisation with no borrowings.

Consider the dividend payouts since 1991.

And the capital expenditures.

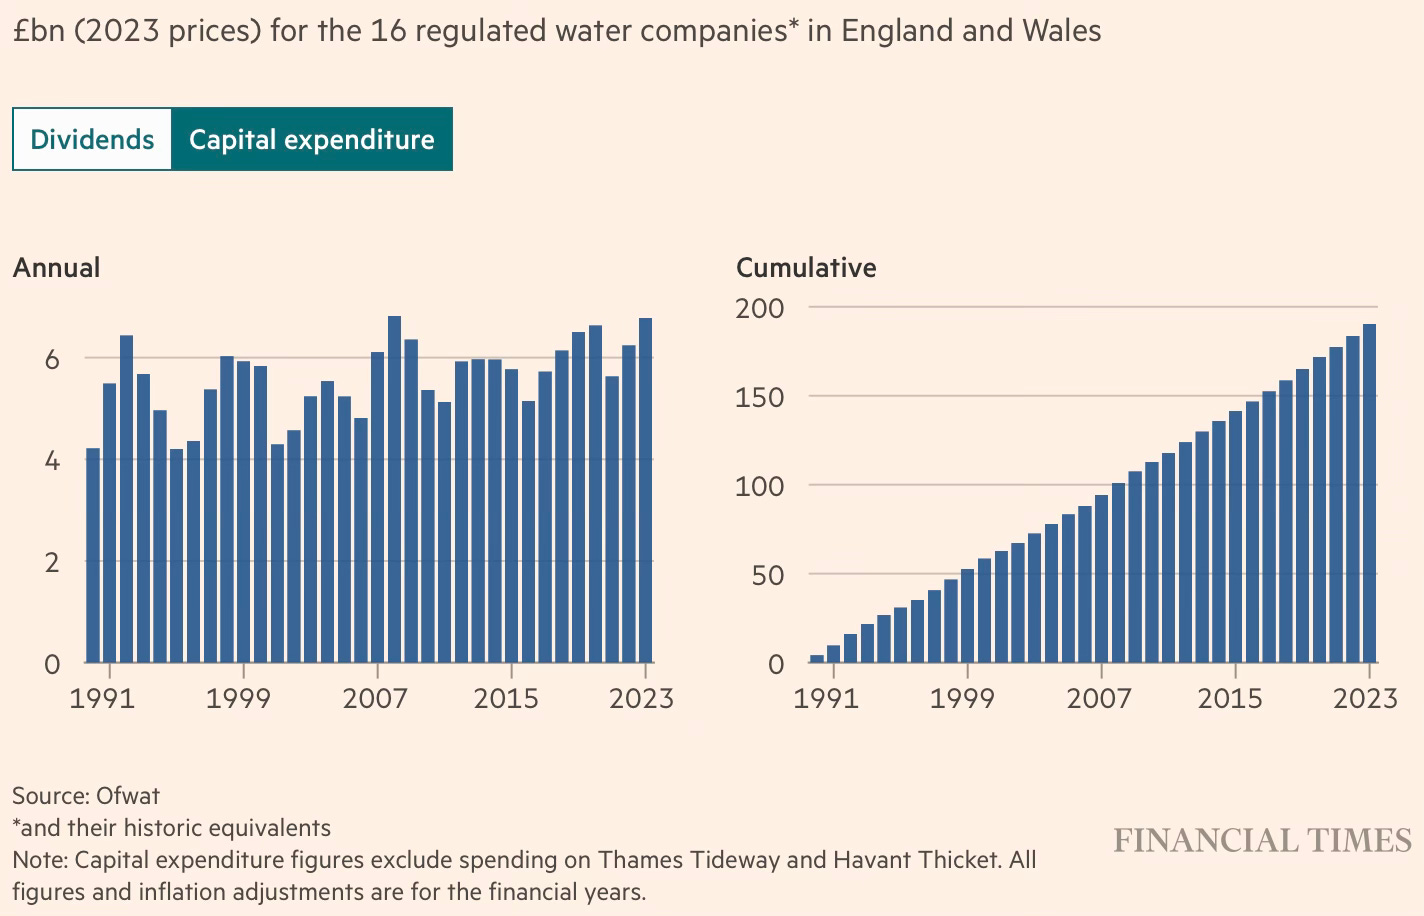
In other words, in the 32 years since privatisation, the owners of the UK water companies took out or created obligations to the tune of £142 bn while investing only £190bn, or a net asset increase of just £48 bn. 

The loading up of debt is a problem in regulated industries like water since the regulator takes the debt service costs into account while fixing tariffs, thereby passing the debt service costs to the consumers through their bills. 

The high noon of such leveraging was the decade-long ownership of Thames Water since 2006 by Macquarie, the Australian infrastructure private equity group. A study by Karol Yearwood at Greenwich University has this summary of the financials of the company during the decade.

Macquarie borrowed more than £2.8bn to finance purchase, and later supposedly repaid £2bn of the debt through new loans raised by Thames Water through a subsidiary in Cayman Islands, effectively transferring the purchase costs to customers. Furthermore, in those 10 years, debt increased 2.3x times (from £4bn to £10bn), dividends averaged 270m per year, yet between 2011 and 2015 they paid no tax.

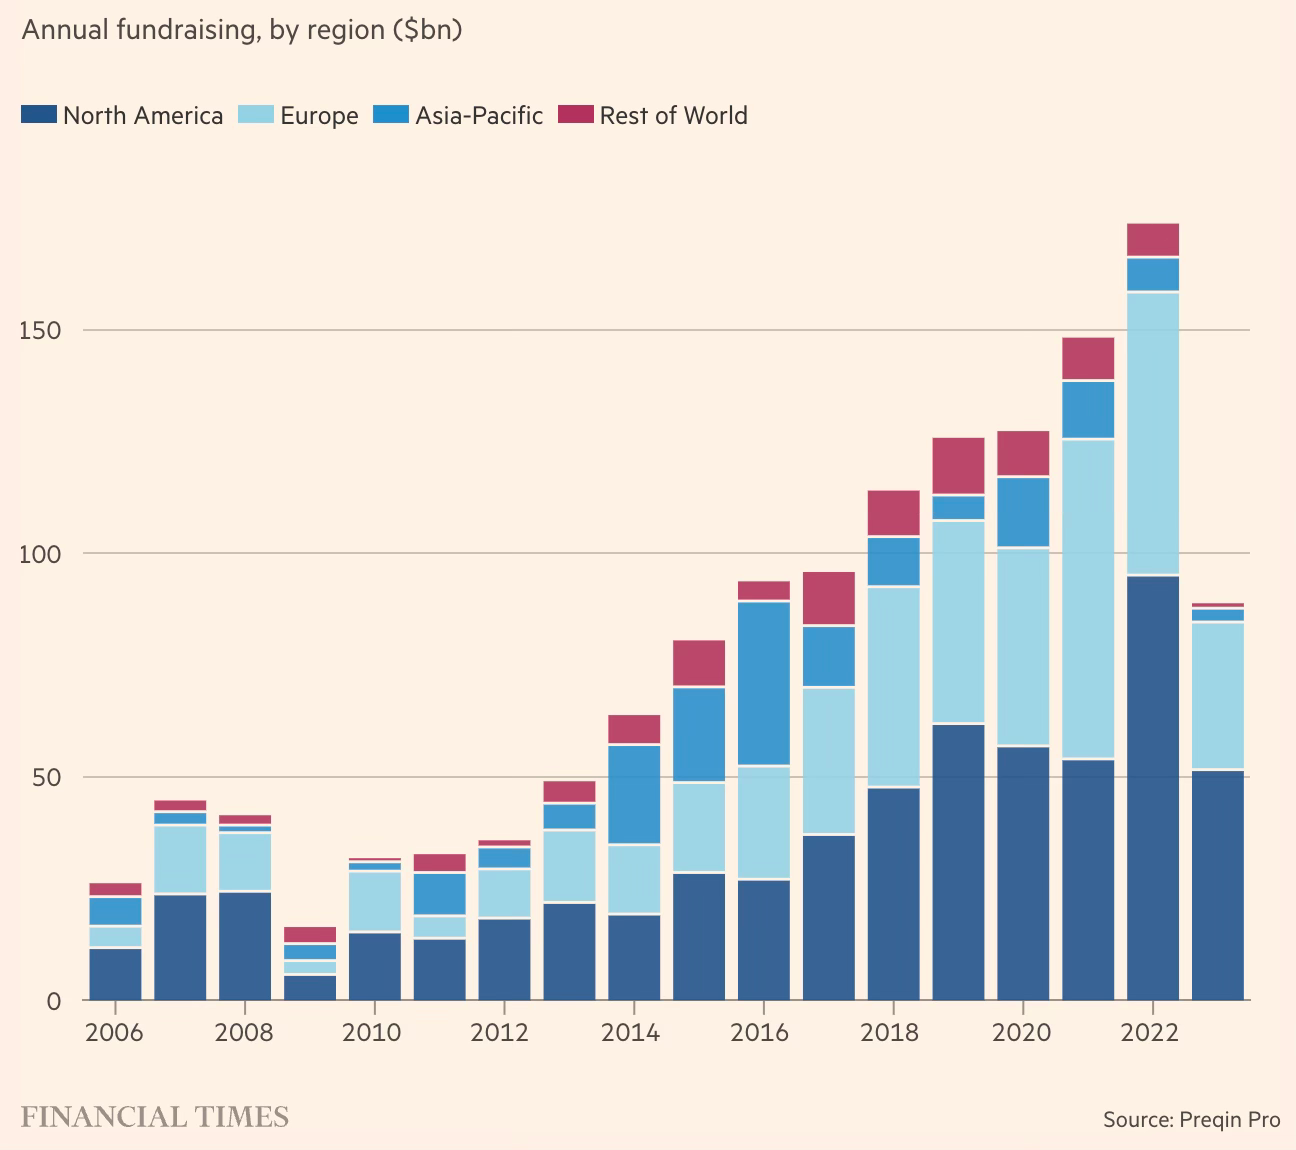
It’s a testament to the distortions in the market that Macquarie’s rent extraction from Thames Water has been an important motivating force behind the private equity industry’s push to invest in infrastructure. 

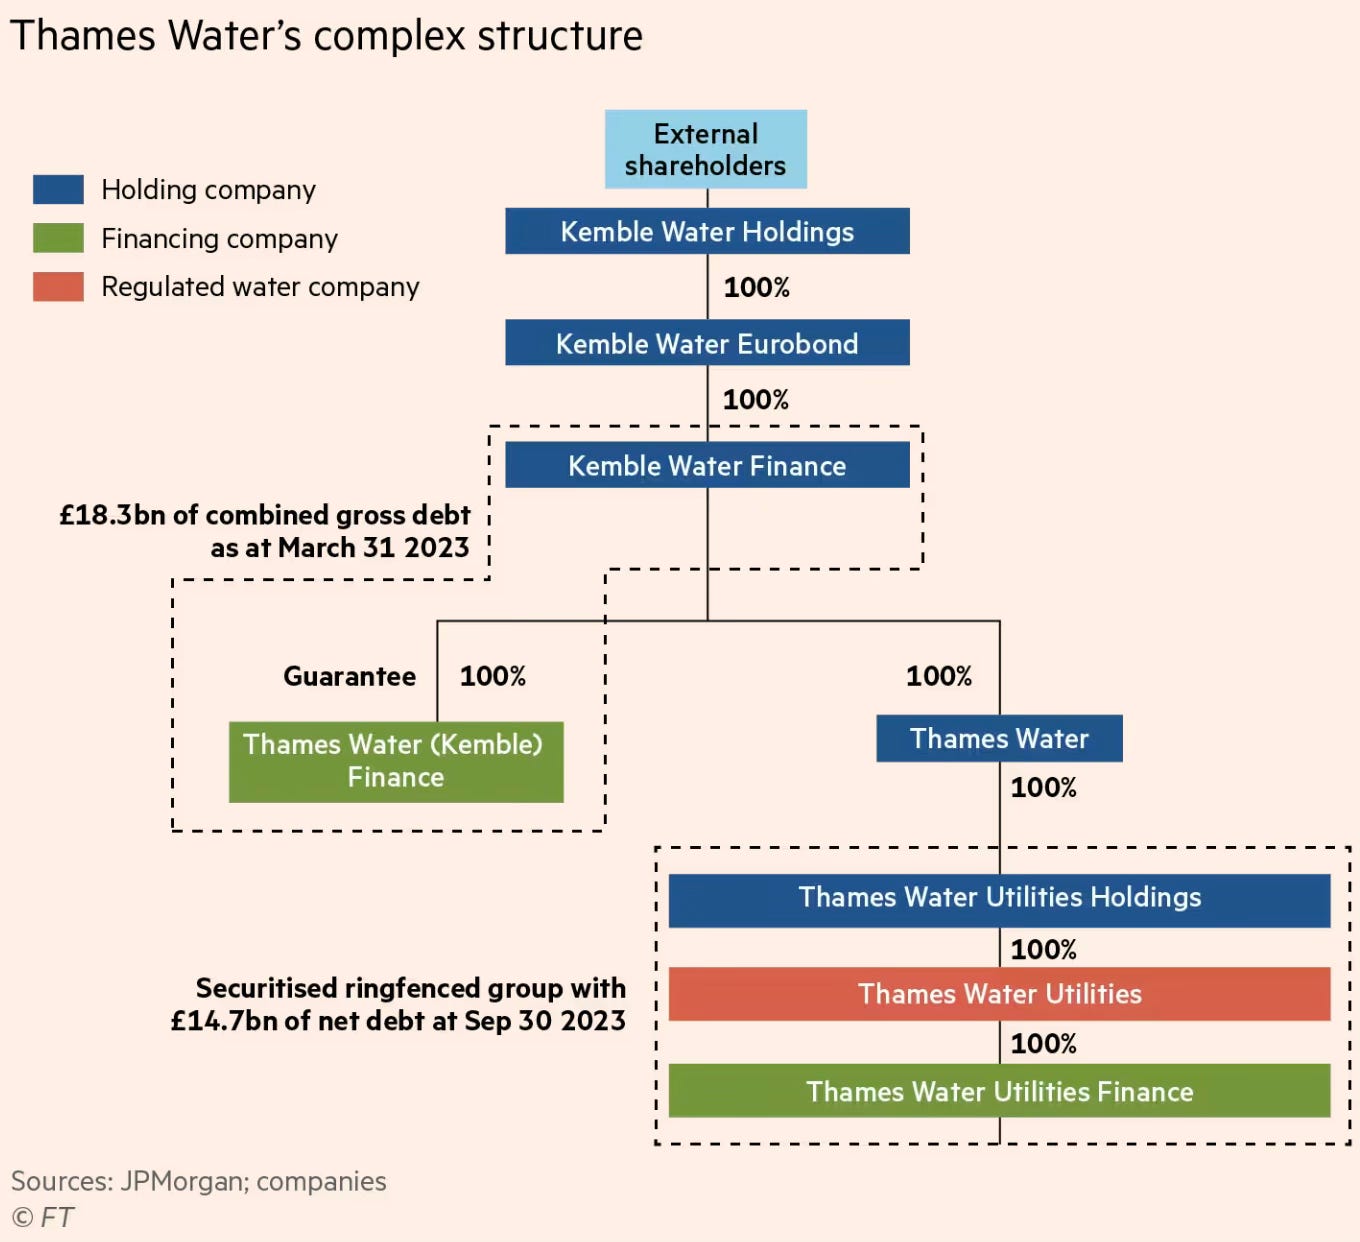
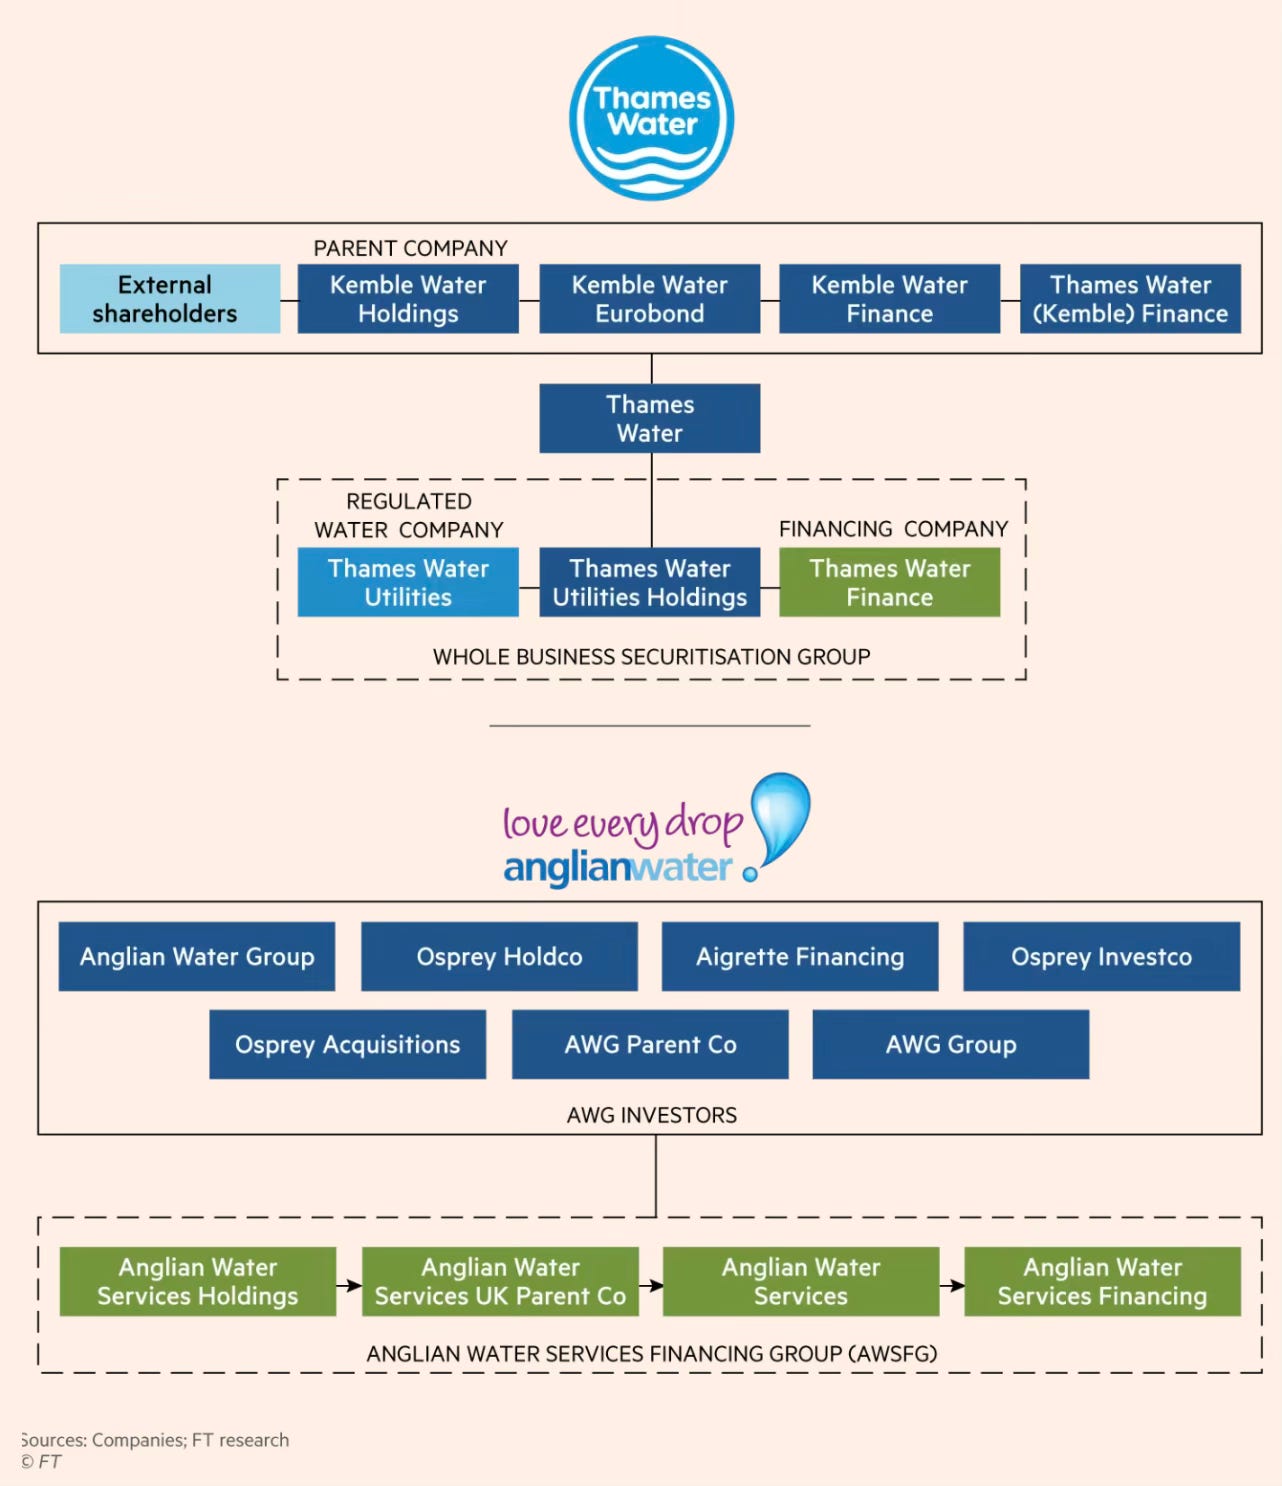
The business model of the private owners has sought to retain earnings and avoid equity infusions and instead use debt to finance investments for maintenance and upgrades while paying out dividends from cashflows. In fact, Thames Water received no equity infusion since privatisation till it got a £515mn loan at an 8% interest rate in 2023 through a convoluted structure - the loan was accounted as a debt in the books of the regulated utility’s parent company (Kemble Water), but accounted as equity in the regulated utility itself

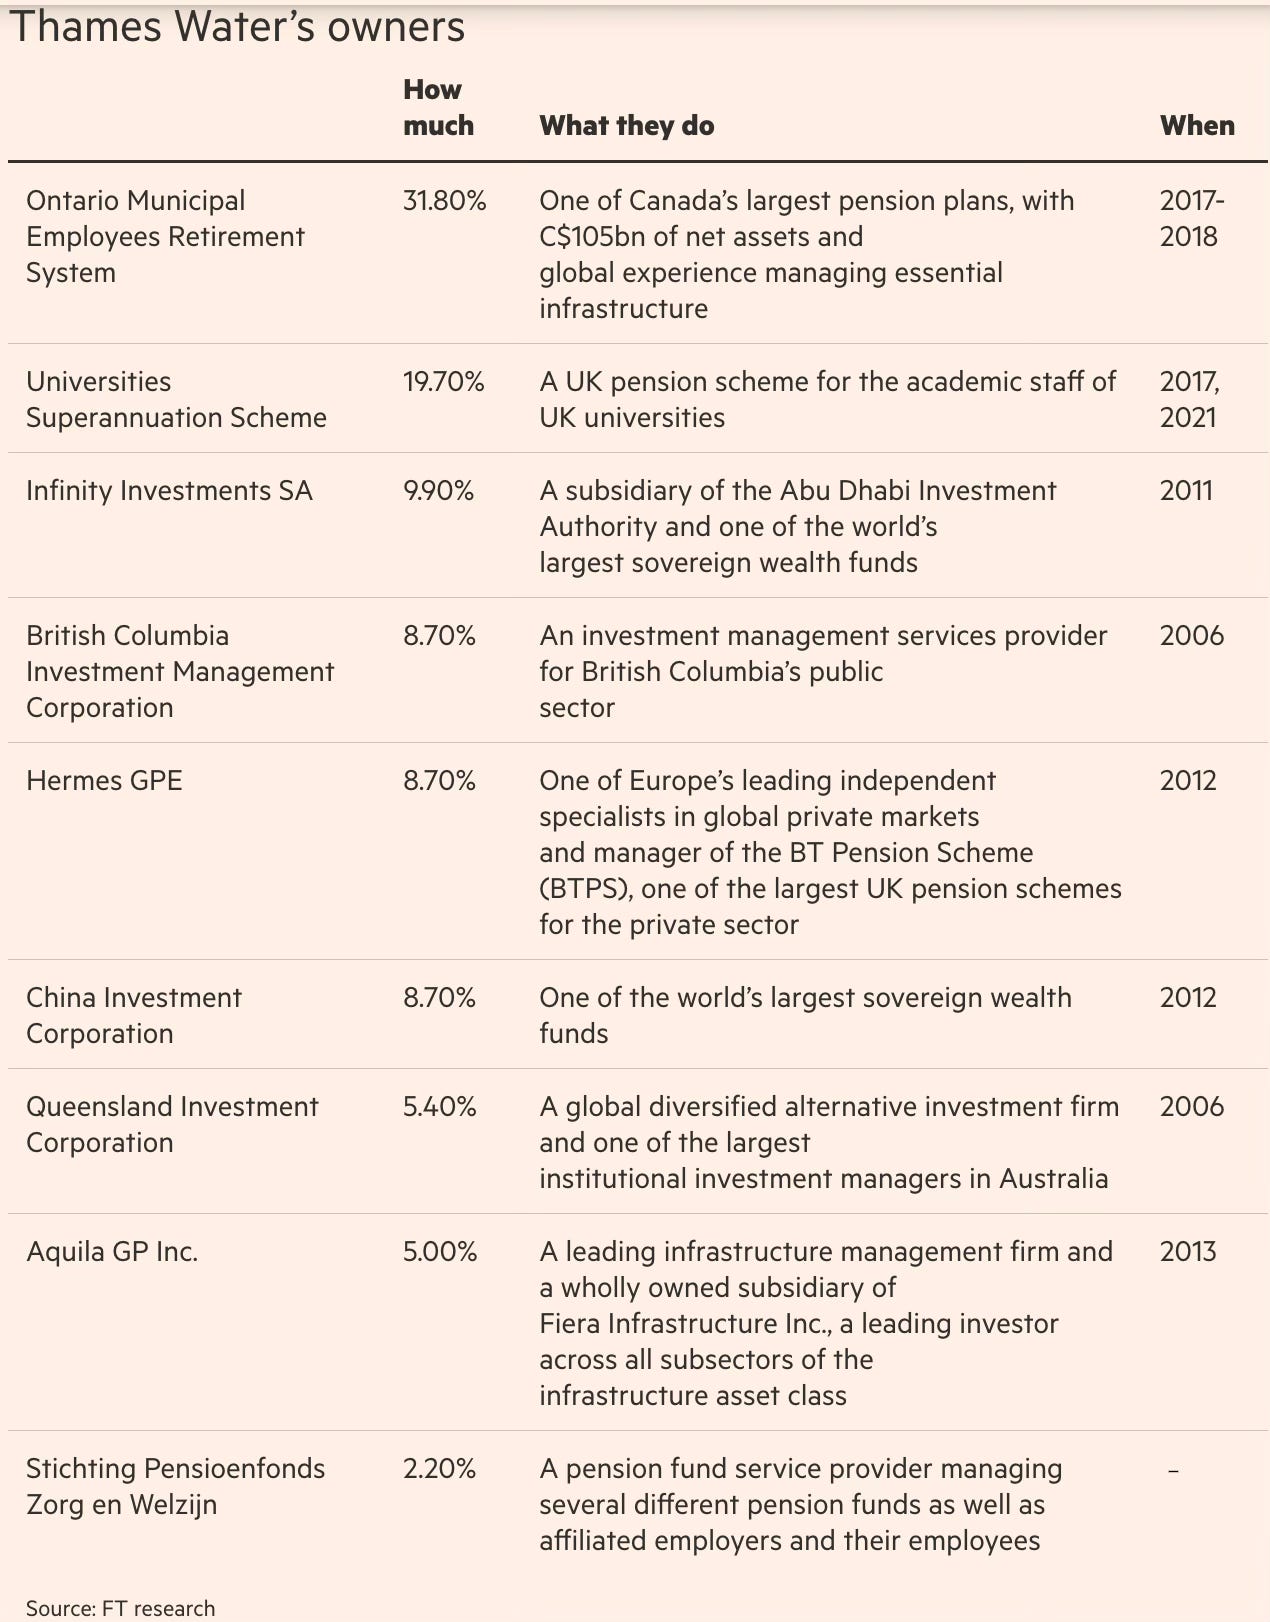
Thames Water, which supplies water to about 25 per cent of the population in England, presented the loan in March as “£500mn of new equity funding from its shareholders” to improve “leakage and river health” and deliver a turnaround plan. However, the recapitalisation involved the owners — which include sovereign wealth, private equity and pension funds — providing a £515mn convertible loan to Thames Water’s parent entity, Kemble Water, according to the company’s accounts. Kemble then “cascaded” £500mn of this borrowed money down the chain of holding companies that own Thames Water into the regulated utility. The £515mn increase in debt at Kemble has pushed the group’s consolidated borrowings to over £18bn, having risen from just over £15bn as of March 31 2022. The loan could convert to equity in the future. It is treated as a liability in Kemble’s accounts.

The owners have used complicated financial structures to not only load up on debt but also payout large dividends.

Britain’s privatised water and sewage companies paid £1.4bn in dividends in 2022, up from £540mn the previous year, despite rising household bills and a wave of public criticism over sewage outflows. The figures… are higher than headline dividends in the year to end March 2022. This is because several have layered corporate structures with numerous subsidiaries, only one of which — the operating company — is regulated by Ofwat… The complex arrangements enable providers to distinguish between internal dividends — payments between intermediate holding companies in the group — and external dividends to private equity, sovereign wealth and pension funds, which own the entire water and sewage business including the holding companies… water monopolies argue internal dividends are used to service debt and other costs… Thames Water, the largest water monopoly, paid £37mn of “internal dividends” to its parent company in the year to March 31 2022. This was an increase from £33mn in the previous 12 months, despite announcing that  “external shareholders” had not received dividends for five years…

Adding to the complexity, internal dividends are often only included in notes to the accounts, while dividends can also be deferred until after financial results are released, enabling companies to show zero dividends for the current year in their published annual reports and accounts. Dividend payments are also often described as “cash neutral” as the funds are immediately returned to the company from within the group in payment of debts. In one example, Northumbrian Water, majority owned by CK Infrastructure Holdings, declared £272.6mn in dividends in the year ended March 2022, including an interim dividend of £58.2mn, and a final dividend of £55.4mn. The final dividend was approved after the balance sheet date and will only show as a paid dividend in the 2023 financial statements. The £272.6mn included £159mn as a special dividend, which the company said enabled a group company to pay off a loan, stating that the transaction was “cash neutral” [implying no cash leaves the business], according to the accounts.

Thames Water is not the only company facing acute stress.

South East Water, SES Water and Southern Water are all under close watch by regulator Ofwat over their financial stability. Southern Water was rescued from the brink of bankruptcy in an Ofwat-brokered deal with the Australian infrastructure manager Macquarie in 2021 but the utility was forced to suspend external dividends until at least 2025 following a credit rating downgrade last year. Investor jitters come as Ofwat is pushing them to inject more cash into the utilities. It is not clear whether investors — which include sovereign wealth funds, private equity firms and pension funds — will play ball. Few equity injections have been made since privatisation.

The business models of the companies that relies excessively on debt has taken the sector to the brink of collapse.

Ofwat wants to lower utilities’ debt. It is pushing them to reduce gearing — a measure of debt to assets — from a sector average of around 68 per cent to 55 per cent by April 2025.  Peter Hope, head of regulatory finance at Oxera Consulting, said water companies will need to change how they run their finances in the next few years, given the step change in investment that is expected. “In broad terms, the industry will have to go from a situation of not having retained any earnings since privatisation, to having to retain for the next 25 years almost all of the earnings.”  In addition they will have to inject £5bn equity by 2030, and £8bn in the five-year period following, according to his calculations based on the 55 per cent gearing ratio assumed in Ofwat’s modelling. “Even this does not take into account the need for future increases to replace aged assets and deal with resilience and climate change,” he added.

The problems in water supply are mirrored on the sewerage and wastewater treatment side. Consider this about investments in wasterwater treatment

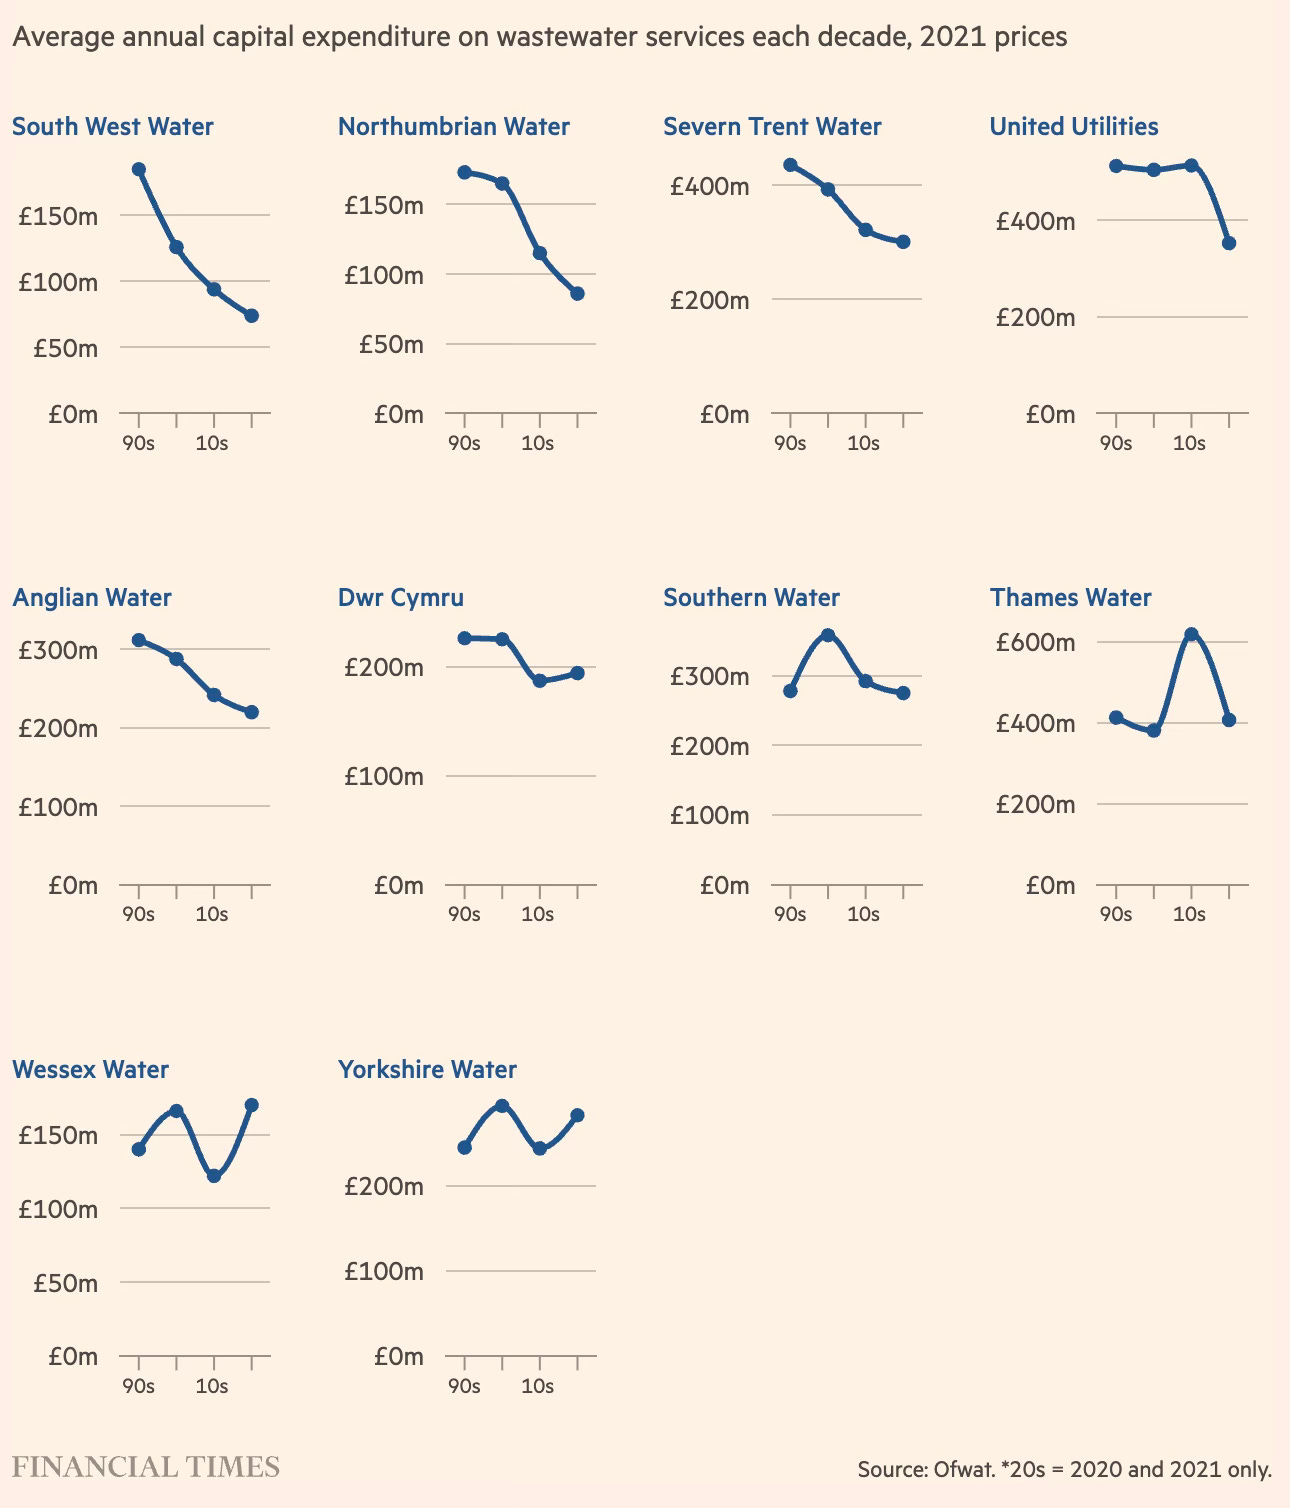
Total spending on waste water infrastructure by the 10 largest companies — excluding Thames Tideway — has failed to rise significantly. Average annual wastewater investment was £295mn in the 1990s, £297mn in the 2010s and £273mn in the 2020s so far.

And this about the worsening quality of waterbodies in the country arising from releases of untreated water.

All 16 companies have been criticised for service failures, including tipping unknown quantities of sewage into waterways, high leakage rates or water outages. The Environment Agency is conducting its largest ever criminal investigation into potential widespread non-compliance by water and sewerage companies at more than 2,200 sewage treatment works, while Ofwat is also running its own investigation into the issue.

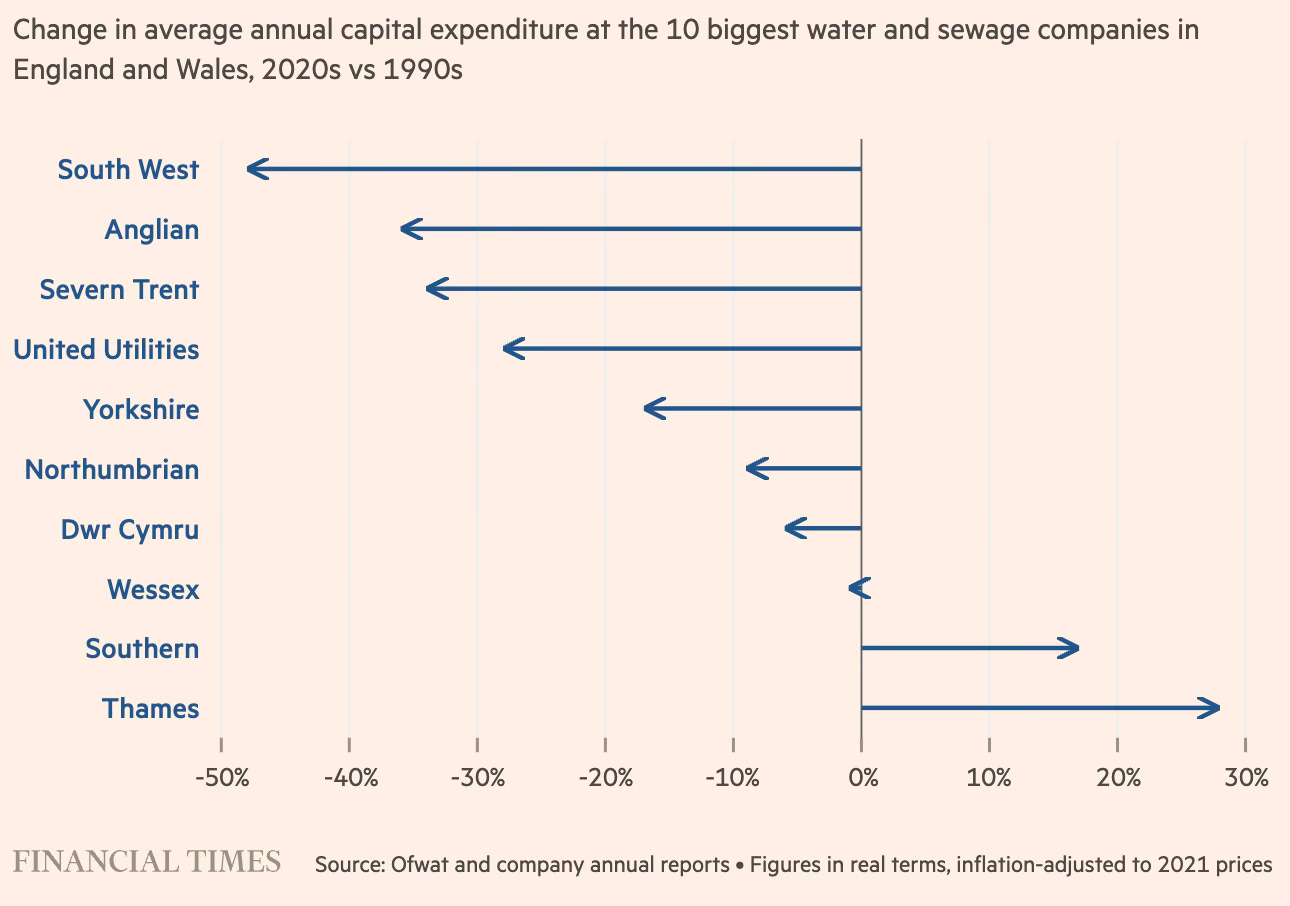
This graphic is striking in so far as it shows that all water utilities have cut their investments in wastewater treatment infrastructure since privatisation. 

Consider this balance sheet of wastewater and sewage infrastructure

Total spending on important infrastructure, which hit a post-privatisation peak of £5.7bn a year between 1991 and 1999, fell by 15 per cent to £4.8bn between 2020 and 2021, according to a Financial Times analysis of the accounts of the 10 largest providers in England and Wales. The decline was most extreme for wastewater and sewage networks. Investment there has fallen by almost a fifth, from £2.9bn a year in the 1990s to £2.4bn now… The reductions have come despite a 31 per cent real-term increase in water bills since the 1990s — an average of £100 a year per household — and £72bn in dividend payments to parent companies and investors including private equity, sovereign wealth and pension funds in the same period… In 2019, only 16 per cent of England’s rivers and seas met the minimum “good or better” ecological status as defined by the EU’s water framework directive, according to official Environment Agency figures, while about a fifth of the treated water supply is lost in leakage.

The most striking finding from the Greenwich University study on water and sewage privatisation in the UK is this graphic that shows that the “privatised water companies have generated enough cash to cover investment without taking debt”.

Since privatisation, the aggregate cash flow generated by the English and Welsh companies after operating costs was £36bn more than the £123bn they spent on fixed assets such as new pipes and network infrastructure (all in 2017-18 prices), the study found. This suggests their capital spending could all have been funded out of internal resources… On a combined basis, customers today pay about £1.2bn a year — or £53 a year per household — servicing the debt, according to the analysis by Karol Yearwood... Funding capital spending with debt rather than free cash flow enabled the English companies to pay out £56bn in dividends to investors, which include an array of private equity type groups. 

In other words, it’s clear that the water companies have assumed such massive debt only to payout large dividends. 

And the comparison of the privatised companies with the only public owned utility, Scottish Water, is revealing.

The English water companies have improved efficiencies since they were privatised in 1989. Their revenues have grown by 34 per cent since 1990-91 in constant currency terms, and operating cash flows have increased by 74 per cent over the same period. But the study claims they are not obviously more efficient than Scottish Water, which remains in state hands: its operating spending per household is about 10 per cent lower than the English companies. Customers’ bills in Scotland have fallen slightly in real terms since 2002, when Scottish Water was established, to about £357 per household in 2018. This compares with a 10 per increase in England and Wales over the same period, from an average of £356 per household in 2002 to £395 in 2018.

The study by Yearwood makes extensive comparisons between the privatised utilities and Scottish water on a host of parameters. It’s illuminating and upends the conventional wisdom about private management being superior to public management, at least in developed countries. 

All this raises fundamental questions about the desirability of private equity investments in regulated sectors and their regulatory treatment. 

“These problems are the failings of a system which encourages companies to extract returns as though it was a high risk business,” said Professor David Hall, a director at Greenwich university. “But water and sewerage services are not high risk.” Other experts have also criticised the regulator. Dieter Helm, a professor of energy policy at Oxford university who focuses on British utilities, said that water privatisation had been a “major regulatory failure”. “The companies were given a £1.5bn green dowry at privatisation and the system was set up to encourage borrowing,” he added. “Were their balance sheets used primarily for capital investment? No. They are private companies so of course they are going to try and maximise profits.” While the practice of companies borrowing to pay dividends is not unknown, it is more controversial in industries — such as water — where the regulator takes financing costs into account when setting prices for services.

The result of all this means that the deeply indebted privatised utilities in UK, and especially Thames Water, are close to renationalisation. In fact, the FT’s Lex column has advocated a “period of temporary public stewardship” would be beneficial and help tackle the complex ownership structure. It may be a good one-time reset to the incentives among financial market participants to wipe out the investors, impose haircuts on creditors, and nationalise the utilities. 

Saturday, April 20, 2024

Weekend reading links

1. Contrary to conventional wisdom, in the long-run smaller companies have outperformed larger ones in generating returns. 

The outsize returns of small companies relative to larger peers was documented in the early 1980s using evidence from the half-century to 1975. The idea found theoretical support. Higher returns compensate investors for taking on the greater risk of backing smaller, younger companies — though that can be minimised in a diversified portfolio... Over the long run, small-cap companies have outperformed larger ones, according to the UBS Global Investment Returns yearbook. Over 43 years in 34 markets, the monthly premium relative to large companies averaged 0.21 per cent. But the premium identified in the 1980s was far bigger. It can disappear — sometimes for years at a time — after periods of strong performance. That pulls down the long-term average.

2. What constitutes physiology of great cricket batting?

A sequence of three movements that produced the longest hits. First, the shoulders and hips pulled away from each other as the batter twisted into a coiled position, like a golfer at the height of a swing. McErlain-Naylor, seated on a Zoom call, demonstrated this well enough to remind me of contrapposto, the idealised stance of ancient Greek statues of discus throwers and warriors: shoulders thrown away from the hips, chest expanded, one leg more tense than the other, the frame taut and strong. Next, the most effective batters flexed their front elbow at the top of the swing and straightened it back out as they brought the bat through their stroke. Finally, they cocked and uncocked their wrists — a final lash of momentum...

James Moore, a psychologist who studies voluntary movement... told me that the brain craves certainty and likes things that flow predictably. “Economy of movement and timing enhance predictability,” he said. “With those who muscle their way through, there are more moving parts, therefore less economy of movement and less predictability.” The best-timed strokes, the most beautiful ones, are those that appear to require nothing beyond a minimal, sweet connection with the ball. “Great art,” he said, “offers no more and no less than the subject matter requires.”

3. The ramp-up in the production of iPhones from India is truly spectacular.

Apple has set a new record by exporting $10 billion worth of iPhones from India during FY24, according to data provided to the government... In terms of consumer products, this constitutes the largest-ever export of a single branded product by any company from India. iPhone exports accounted for 70 per cent of Apple’s total production in FY24. Of the three suppliers, Foxconn exported 60 per cent of its total iPhone output; Pegatron 74 per cent; and Wistron (now the Tatas) 97 per cent. Apple’s total iPhone production by its three suppliers touched $14 billion during the financial year... In FY24, the cumulative export target under the PLI scheme for the three suppliers was $7.2 billion, a target they have exceeded by 39 per cent... In future, as Apple expands capacity in India, it is expected that exports will cross 80 per cent of its total production from India. Apple is the first global value chain lead firm that has made India its home, primarily for labour-intensive manufacturing exports, rather than for the domestic market...
The total exports of mobile phones from India are expected to cross $15 billion in FY24, making Apple by far the largest contributor with nearly two-thirds of the total. The Apple ecosystem has generated nearly 150,000 new direct jobs since the launch of the PLI scheme and approximately 300,000 additional indirect jobs... While the domestic market for Apple products in general and the iPhone in particular is growing fast, the company’s revenue of Rs 49,321 crore for FY23 merely constituted 1.5 per cent of Apple’s global turnover of $383.29 billion. Its FY24, revenue is expected to increase over the previous fiscal by over 30 per cent.

4. Good primers by Shyam Saran and Shankar Acharya on the emerging situation in Myanmar where the military junta is losing control over large parts of the country's territories to the resistance forces of the ethnic minorities and the army mobilised by the opposition National League for Democracy (NLD) led by Aung Sang Suu Kyi's parallel National Unity Government (NUG). The junta has been on the back foot after the civil war broke out following its refusal to recognise the electoral verdict in 2021 won overwhelmingly by the NLD which represents the Burman majority. The junta carried out a military coup and installed itself in power, forcing the resistance from NLD and ethnic minorities. 

5. The national highways monetisation program of the government of India must count as one of the great successes of PPP anywhere in the world. The NHAI has been doing monetisation through TOT bundles and Infrastructure Investment Trusts (InvIT). 

The authority has so far issued 14 bundles of national highways in the TOT mode. This instrument gives highway players the right to collect toll for a specific period by paying the authority upfront cash. The valuation is arrived at through competitive bidding. After having struggled with getting bids considered fair by the authority, NHAI has awarded 10 TOT bundles to raise Rs 42,000 crore since the beginning of the asset monetisation pipeline. In InvIT, the trust which has numerous tax benefits for investors, buys the road from the authority and operates it. It distributes toll earnings in the form of return on units. NHAI has executed three rounds of offers through its InvIT, raising close to Rs 26,000 crore... In FY24, the highway authority had identified 46 national highway stretches, spanning 2,612 km for monetisation through ToTs and InvIT. It finished the financial year, meeting over 90 per cent of its target of Rs 44,000 crore... NHAI had monetised highway assets worth Rs 40,314 crore, through its three models — TOT, InvIT, and toll securitisation — for specific projects, such as the Delhi-Mumbai expressway... The National Highways Authority of India (NHAI) is looking to monetise 33 stretches of national highways during the current financial year (FY25) through its toll operate transfer (TOT) and infrastructure investment trust (InvIT)... Cumulatively, the 33 stretches, spanning 2,741 kilometres (km) earned approximately Rs 5,000 crore revenue in FY24.

6. Harish Damodaran has a brilliant article where he points to some interesting facts about Tamil Nadu, the state with the most diversified economy. This about diversification in agriculture itself.

About 45.3% of TN’s farm GVA comes from the livestock subsector, the highest for any state and way above the 30.2% all-India average. Not surprisingly, TN is home to India’s largest private dairy company (Hatsun Agro Product), broiler enterprise (Suguna Foods), egg processor (SKM Group) and also “egg capital” (Namakkal).

And this about the nature of its industrialisation

TN has just a handful of large business houses with annual revenues in excess of Rs 15,000 crore: TVS, Murugappa, MRF, Amalgamations and Apollo Hospitals. Even they are not in the league of Tata, Reliance, Aditya Birla, Adani, Mahindra, JSW, Vedanta, Bharti, Infosys, HCL or Wipro, as far as turnover goes. TN’s economic transformation has been brought about not by so-called Big Capital as much as medium-scale businesses with turnover range from Rs 100 crore to Rs 5,000 crore (some, like Hatsun and Suguna, have graduated to the next Rs 5,000-10,000 crore level). Its industrialisation has also been more spread out and decentralised, via the development of clusters. Some of the clusters – agglomerations of firms specialising in particular industries – are well known: Tirupur for cotton knitwear (the units there clocked exports of Rs 34,350 crore and Rs 27,000 crore of domestic sales in 2022-23); Coimbatore for spinning mills and engineering goods (from castings, textile machinery and auto components to pumpsets and wet grinders); Sivakasi for safety matches, fire crackers and printing; Salem, Erode, Karur and Somanur for powerlooms and home textiles; and Vaniyambadi, Ambur and Ranipet for leather. 

Many cluster towns are hubs for multiple industries. Thus, Karur has powerlooms, bus body builders and even makers of mosquito and fishing nets (one of them, V.K.A. Polymers, is a major exporter of insecticide-treated bed nets). Dindigul has spinning mills and leather tanneries. Namakkal is as famous for layer poultry farms as its large lorry fleet/bulk cargo logistics operators and tapioca-based sago (sabudana) factories. Salem has powerlooms and tapioca starch-cum-sago producers, while Erode is a textile and “turmeric city”. In contrast to them are the more sub-specialised clusters. Chatrapatti, in Virudhunagar district’s Rajapalayam taluka, is “bandage city” not for nothing: It is a manufacturing centre for bandages, gauze pads/rolls/swabs and other surgical cotton products and woven dressings.

Tiruchengode is India’s “borewell rigs capital”. The borewell drilling services contractors of this town near Namakkal take their truck-mounted rigs all over the country to dig up to 1,400 feet. Dhalavaipuram, hardly 10 km from Rajapalayam, specialises in production of nighties and ladies innerwear, just as Natham, next to Dindigul, does in low-priced men’s formal shirts. Most of these clusters have come up in small urban/peri-urban centres, providing employment to people from surrounding villages who may otherwise have migrated to big cities for work. They have, moreover, created diversification options outside of agriculture, reducing the proportion of TN’s workforce dependent on farming.

TN’s early industrialists were mainly Nattukottai Chettiars and Brahmins... Prominent among them were Annamalai Chettiar (the M.A. Chidambaram and Chettinad groups descended from him), A.M.M. Murugappa Chettiar (Murugappa Group), Karumuttu Thiagaraja Chettiar (textile magnate) and Alagappa Chettiar (textiles, insurance, hotels and education). The big Tamil Brahmin-owned houses included TVS, TTK, Amalgamations, Seshasayee, Rane, India Cements, Sanmar, Enfield India, Standard Motors and Shriram. A more recent name is the business software solutions company Zoho Corporation of Sridhar Vembu. The drivers of TN’s more recent decentralised industrialisation have, however, been entrepreneurs from more ordinary peasant stock and provincial mercantile castes...
The promoters of Suguna Foods, CRI Pumps, Elgi Equipment and Lakshmi Machine Works, too, are from Kammavar Naidus. The cluster capitalists of Tirupur, Erode, Salem, Namakkal, Karur and Dindigul are mainly Kongu Vellalar or Gounders... Sivasaki’s fireworks, match and printing industries have been built largely by Nadars. But this belt in southern TN – also covering Virudhunagar, Srivilliputhur, Watrap and Rajapalayam – has produced entrepreneurs from other communities as well: Raju (Ramco Group and Adyar Ananda Bhavan) and Udayar (Pothys). Many from here have also gone on to create successful product brands: Hatsun (‘Arun’ ice-cream and ‘Arokya’ milk), V.V.V. & Sons (‘Idhayam’ sesame oil) and Kaleesuwari Refinery (‘Gold Winner’ sunflower oil)... Christians (MRF, Johnson Lifts and Aachi Masala Foods) and Muslims (Farida Group)... CavinKare’s C.K. Ranganathan, a Mudaliar, was selling ‘Chik’ shampoo (taken from his father Chinni Krishnan’s name) in single-use sachets well before the likes of Hindustan Unilever latched on to the idea.

7. One line of thinking about the impact of high-interest rates on the US economy is that it may be responsible for sustained economic growth.

The jump in benchmark rates from 0% to over 5% is providing Americans with a significant stream of income from their bond investments and savings accounts for the first time in two decades. “The reality is people have more money,” says Kevin Muir, a former derivatives trader at RBC Capital Markets who now writes an investing newsletter called The MacroTourist. These people — and companies — are in turn spending a big enough chunk of that new-found cash, the theory goes, to drive up demand and goose growth.

8. Andrew Haldane has some home truth about inflation forecasting within central banks.

In the early years of inflation targeting in the UK, the then head of forecasting at the Bank of England entered my room clutching a piece of paper. On it were two lines: the inflation forecast produced painstakingly by his team over the preceding weeks, and an alternative inflation projection hand-drawn in pencil by the then governor. Only the latter “forecast” ever saw the light of day... Former central bank governor Mervyn King used to observe that the probability of forecasts proving correct was almost precisely zero. (Ironically, this is one of the few BoE forecasts ever made that turned out to be accurate.)..

Economic models bring rigour to policy. Unfortunately, they also bring mortis. Even models at the frontier are always at least one step behind real-world events: from the global financial crisis (when most were found to take no meaningful account of the financial sector) to the Covid-19 and cost of living crises (when most were found to have no well-developed sectoral supply side). In these instances, models served to unhelpfully blinker policymakers to events playing out before their eyes, but not embedded in their models. This led to them first missing these crises, and then responding too slowly. Those models can also be gamed in ways that impose too few constraints on policy. In my experience, many policymakers produced their economic forecasts by working backwards from their preferred stance. This is an inversion of the way inflation targeting was meant to operate.

9.  It's not UK, but Sweden that has the deepest capital markets in Europe. 

At a time when the UK and many other European countries are struggling to attract initial public offerings and suffering from falling trading volumes, Sweden stands out for having, relative to its size, thriving capital markets that are backed by legions of investors and which are even tempting foreign companies to list... Over the past 10 years, 501 companies have listed in Sweden, more than the total number of IPOs in France, Germany, the Netherlands and Spain combined, according to Dealogic data. The UK is top with 765 listings... the Nordic country has been highly successful at encouraging smaller domestic businesses to stay at home, encouraged by the depth of its stock market... Around 90 per cent of listings are valued at less than $1bn... A key driver has been the country’s investment culture.

Consider the preference for equity investment among insurers.

Among larger investors, Swedish pension funds have long owned domestic equities. The country’s four biggest retirement schemes have roughly maintained or increased their holdings of domestic equities in recent years. In the UK, in contrast, domestic equity holdings among pension funds have plunged to about 4 per cent. Meanwhile, Swedish insurance companies have the highest holdings of stocks in the EU.

Swedish households are the most avid retail investors in Europe.

Retail investors are also big buyers of Swedish stocks, helped by a wealth of reforms in recent decades. Compared with the rest of Europe, Swedish households hold among the highest proportion of their investments in listed companies and among the lowest in bank deposit holdings, while financial literacy is greater than in Germany, France or Spain. In 1984, the government introduced Allemansspar, a product enabling ordinary Swedes to invest in stock markets. By 1990 there were already 1.7mn of these accounts, helping drive the launch of domestically focused small and mid-cap funds. Such funds arrived “10-to-20 years before any other country did anything similar, at least in Europe”... Rule changes in the 1990s allowed people to invest 2.5 per cent of the amount they allocate to their pensions into funds of their choice, supported by a public information campaign. And in 2012 the state introduced investment savings accounts called ISKs that allow individuals to invest without needing to report their holdings or worry about capital gains or dividend tax. Instead, the total value of the account is taxed — and in 2024 that was at a level of about 1 per cent... German investors have historically favoured bonds over stocks, making equity raising more challenging.
And Swedish companies are far more likely to be listed than peers. 
And the net result of all this has been positive
Sweden’s system appears to have translated into stock market returns. Its main index has gained 85 per cent over the past decade, while the Euro Stoxx 600 index has risen 49 per cent and London’s FTSE 100 just 17 per cent. That, too, is helping persuade Swedish small and mid-sized companies to stay at home.

10. Chinese State Owned Enterprises (SOEs) are doing better than the broader stock market index among Chinese stocks, mirroring trends in India too.  

11. Good read in Business Standard on the struggles facing the apprentice system in India, where just 1% of work force entrants are apprentices. 

Wednesday, April 17, 2024

Ability to exercise good judgment is the binding constraint in development

The most important constraint in economic development is not capital, labour or other factors, but the “ability to make development decisions”. This is the point that Albert Hirschman makes in his classic book, Strategy of Economic Development, says Oliver Kim in an excellent essay on one of the truly great economists. 

Rather than endlessly debate which prerequisites for growth a poor country is missing, Hirschman shifts the focus to figuring out how to make the best use of the resources it already has. But, without the guidance of a grand plan, how should policy makers decide how to allocate their attention? The solution Hirschman proposes is unbalanced growth. Instead of trying to solve all problems all at once, policy-makers should push forward in a limited number of sectors, and use the reactions and disequilibria created by those interventions to inform their next move.

Take the example of an industrial district. With limited resources, a policymaker may have to choose between building the actual factories, or laying down the highways and power-plants (what he calls Social Overhead Capital) to supply it. Based on his theory, Hirschman makes the provocative case that infrastructure should sometimes follow, not lead, private investment… Hirschman encourages us to flip the script. Rather than see bottlenecks and shortages as embarrassing signs of failure, policy makers can use these pressure points to identify opportunities where an additional investment might go the farthest. With the road congested, it’s much easier to see it needs to be improved–and far better to upgrade a well-used road than build a highway to nowhere. The policy-maker, once inundated with choices, now has a clear guide on how to act. Even better, pressure points may organically summon other, non-state actors to try and address the now-glaring shortfall. Perhaps an independent power producer will spy a market opportunity, or a private railway may decide to step in and connect the factory to their network.

Hirschman formalizes this insight with his famous notion of backward and forward linkages. Backward linkages are the demand created by a new industry for its inputs, like steel for an auto plant or milk for a cheesemaker. Forward linkages are the reverse—the knock-on effects of a new industry’s outputs on the firms it supplies. Backward linkages, Hirschman goes on to explain, are better at spurring growth than forward ones. Rather than plopping down a steel factory somewhere, with no customers assured, it is far easier to build the auto plant first, sourcing the car parts from other countries as needed, then gradually entice local producers to enter the market. Instead of a Big Push across all industries at once, Hirschman calls for the Targeted Strike–choose the sectors with the most potential to create demand for other inputs, and support those.

Hirschman also argues that the “nonmarket” responses induced by a policy change may be just as important as market ones. If, say, the factories in the industrial zone face a shortage of trained workers, the locals may clamor for new schools. Or if the trucks congest their neighborhood roads, they may pressure their local officials to improve the highway. Politics cannot be separated from economics when thinking about developmental choices. Hirschman’s theory of unbalanced growth is rooted in empiricism, allowing policy makers to test and gauge the reactions of the specific context rather than applying some universal formula. It recognizes that development is naturally a chaotic, messy process, much closer to a “chain of disequilibria” than the result of a master plan. To paraphrase another important development thinker, Hirschman’s unbalanced growth is the modest call to cross the river by feeling the stones, one intervention at a time.

This brilliant. Hirschman makes a very profound observation, one that is genuinely difficult to grasp and also unsettling. It resonates strongly with my instincts as a practitioner of development. 

I’ll frame it slightly differently and in terms of a framework I’ve found useful (see this and this). The development decision that Hirschman alludes to is the “ability to exercise good judgment”. Almost all of doing development is about making non-technical decisions (the technical ones are easier, have limited degrees of freedom, and mostly slot themselves into place). Such decisions are invariably an exercise of judgment by taking into consideration several factors, one of which is the technical aspect (or expert opinion). The most important requirement for the exercise of good judgment is experience or practical knowledge. In the language of quantitative science, it’s about having a rich repository of data points that one can draw on to process a decision. 

The Greeks describe this synthesis as phronesis, or practical wisdom. In practice, as the history of development shows, given the political economy, organisational bargaining, and distorted incentives, such judgments many times go astray. 

It gets more complicated. It’s not one decision, but a series of continuing, even interminable, decisions. In other words, a country’s development trajectory is determined by a continuing series of judgments. This applies to industrial policy and promotion of industrial growth, macroeconomic policy and inflation targeting, and programs to improve student learning outcomes or skills, increase nutrition levels and health care outcomes, improve agricultural productivity, and so on. 

Institutional structures that facilitate information flows and create the right incentives are perhaps essential to create the conditions for good judgments to emerge. But enlightened and wise leadership often papers over institutional failings, at least for some time. A combination of both is ideal. 

This judgment is made at both tactical and strategic levels. At the former, it’s about an immediate response to an emerging issue or situation, whereas at the latter, it’s about keeping in mind long-term considerations. In the latter, sometimes an exercise of judgment can be about “losing the battle to win the war”, “shooting in a different direction to the target”, “embracing the enemy and building coalitions”, and so on. 

Travelling the development journey can be like driving a car at night or in dense fog. It’s like what EL Doctorow said in another context, “It's like driving a car at night. You never see further than your headlights, but you can make the whole trip that way.” Add that you are driving at night on a road with several forks and must make the right decisions to reach your destination. The metaphor is apt for the development journey. 

Every example of successful development journeys in recent times from Singapore under Lee Kuan Yew to China under Deng Xiaoping to South Korea under Park Chung-hee and their respective successors, has been about “driving a car at night on roads with several forks and turns” or “crossing the river by feeling the stones”. These journeys have been about the right political and institutional incentives and wise leadership combining to create the conditions for the exercise of a series of good judgments that in turn facilitated “good development decisions”. 

Such judgments can sometimes go wrong. It’s common in national development journeys to have bad judgments (or misjudgments), even phases of several bad judgments. The more complex the context, the greater the likelihood of mistakes. Most commonly, bad policies and bad leadership often stray into the path and can derail the journey. 

The challenge is not to avoid these mistakes, for they are inevitable. But to have institutional incentives that allow mistakes to get quickly detected, deliberated, and rectified. This means institutional acceptance of failures and the space for deliberation within the policy-making and implementation systems. Strong institutional systems can help countries that have gone astray recover lost ground and get back.

There are strong parallels here with the private sector. Amazon did not plan to get where it stands today when Jeff Bezos started in 1995. No company plans its life beyond a handful of years. Yes, they’ll have strategic plans and all, but in terms of operation or execution, their time horizons are limited. But they have systems (and also incentives) to respond to emerging developments in the market. This response involves an exercise of judgment. 

The best companies are those that respond swiftly and effectively to external stimuli. They also have the conditions that allow experimentation, tolerate failures, quickly cut losses and kill failing ideas. These decisions are also about the exercise of judgment. 

To this extent, private sector growth is also constrained by “decision-making ability”. However, the conditions under which the judgment has to be exercised are far less complex than in government. In some ways, in general, the difference is like that between driving in dense fog and clear conditions, or roads with more and few forks. Most importantly, there’s the disciplining force of the markets that aligns incentives and channels the leadership towards making the right decisions. This important institutional incentive does not exist in governments, except in the theory that there’s a marketplace for votes that aligns with the incentives of politicians. 

This explanation is just as relevant for national development trajectories as it is for the implementation of individual policies and programs. As I have blogged here, there are no perfect policies or programs. Their success is mostly about their implementation. And implementation, to be effective, must be necessarily iterative, involving a series of decisions that are essentially exercises of judgments. 

All this does not mean there’s no space for technical and professional expertise. On the contrary, good judgments are built on the foundations of which expertise is an important ingredient. It’s only that they go much beyond technical and professional expertise. It’s most critically dependent on the experiential knowledge accumulated over a long time of practice. It’s this important distinction that experts and commentators who engage with policy from the outside struggle to grasp. For most, it’s an unknown unknown. 

In conclusion, I’ll slightly modify Hirschman and argue that the binding constraint in economic development is the “ability to exercise good judgment”!

Monday, April 15, 2024

Lessons from the Thames Water Fiasco

In one more exhibit on the problems with the privatisation of utilities, early this month, Kemble Water Finance, part of the complex financial structure constructed by Macquarie at Thames Water, the largest British water utility serving a quarter of the population and one that provides water to London, announced that it was defaulting on its £400mn bond repayments. This follows its shareholders refusing to make the promised £500mn equity infusion because Ofwat refused to agree to their demands for higher bills and in turn demanded that the shareholders reduce the company’s debt pile. 

The £14.7bn of debt held by the Thames Water utility companies that sit below Kemble should be unaffected by the default. This debt is in the form of a whole-business securitisation, a structure commonly used to borrow against highly regulated assets with predictable cash flows. But it threatens to wipe out the stakes of Thames Water’s nine shareholders, which include the Chinese and Abu Dhabi sovereign wealth funds as well as Canadian and UK pension funds. Further, Kemble’s £400mn bonds are trading at little over 15 per cent of their face value, indicating debt investors too are set for a near-total wipeout. Most importantly, it raises questions about how Thames Water itself will be able to repay the £14.7bn of debt. 

This is the list of Thames Water’s owners.

Underlining the complexity of the financing structure, JP Morgan published this outcome-probabilities chart.

The FT article writes about the origins of Kemble’s troubles

The Kemble debt is a legacy of Thames Water’s 2006 buyout by Macquarie, which has drawn scrutiny for the billions of pounds in dividends the firm siphoned off during its decade-long ownership. Macquarie put in place a so-called “whole-business securitisation”, where the utility’s cash flows service different tiers of debt. Kemble, named after a village in the English countryside near the source of the river Thames, allowed the firm to borrow more money. Kemble relies on dividends from Thames Water to pay interest to its bondholders and lenders. However, new rules introduced by Ofwat last year prevent the payment of dividends from the utility if they put the company’s financial resilience at risk. Ofwat opened an investigation into a £37.5mn dividend paid by Thames Water in October last year, with a ruling expected within weeks.

Then there’s also the inflation-indexed nature of the debt, which forms more than half the utility’s debt. 

The 2022 annual accounts of parent company Kemble Water Holdings show that the weighted average interest on the group’s £7.7bn of “index-linked debt” soared to 8.1 per cent from just 2.5 per cent the previous year… An “inflation risks sensitivity analysis” — which conceded that the RPI-linked debt only acted as a “partial economic hedge” — showed that a 1 per cent increase in the rate of inflation after 31 March 2022 would dent the group’s profit and equity by £911mn.

The original sin of course lies in the 2006-17 ownership of Thames Water by Macquarie

When the former prime minister Margaret Thatcher privatised the water monopolies in 1989, she wiped out their debt. Since then, Thames Water’s group borrowings have grown to £18.3bn as the company passed from owner to owner. By 2006, when the Australian asset management firm Macquarie bought Thames Water from the Germany utility group RWE, the water company had £3.4bn in debt. By the time Macquarie sold its final stake in Thames Water in 2017, the company had spent £11bn from customer bills on infrastructure. But far from injecting any new capital in the business — one of the original justifications for privatisation — £2.7bn had been taken out in dividends and £2.2bn in loans, according to research by the Financial Times. Meanwhile, the pension deficit grew from £18mn in 2006 to £380mn in 2017. Thames Water’s debt also increased steeply from £3.4bn in 2007 to £10.8bn at the point of sale.

All this means that in the absence of dividend inflows from Thames Water, Kemble Water Finance is insolvent. With the existing shareholders preferring to take an estimated £5bn loss and cut further losses and not put in any more money, complete equity wipeout and large debt haircuts look inevitable. Any restructuring which does not provide a long-term financing solution for Thames Water, an increasingly difficult prospect, would effectively end up being a return to nationalisation of an asset that was privatised in 1989! A nationalisation should come as no surprise since the latest YouGov polls find that 69% of people believe water companies should be nationalised. 

In this context, Frédéric Blanc-Brude points to the problems with using traditional CAPM models to calculate the fair value of investments. 

At the end of 2022, a group of large pension plans, including funds from Canada, Japan and the UK, discovered that they had lost a large part of the £5bn investment in Thames Water that they had recorded on their books. This Easter, they learnt that they had probably lost all of it. There is only one way for a water utility serving the capital of a G7 country to lose so much value so fast: it was never worth £5bn to begin with.  Yet its owners denied this reality for years. The signs that Thames Water and its parent Kemble Water Finance constituted a high-risk, low-profit business were there all along. The cost of capital in this investment should have been considered quite high (and increasing over the years) and its value much lower… 

Many investors in private assets — and in this case the water sector regulator, Ofwat, too — rely on the “capital asset pricing model” (CAPM) to estimate a cost of capital and the value of the business (and for Ofwat the allowed level of water tariffs)…. Today, CAPM remains the most commonly used framework for estimating the value of private investments like infrastructure companies.  Yet the scientific community has known for more than 30 years that CAPM, while one of the foundations of the field of academic finance, is wrong… The inevitable conclusion from all this is that the reported values of private investments held by institutional investors and their managers today are very likely to diverge significantly from their true market value, and do not represent the level of risk taken or the liquidation value of these assets. This is how investors in Thames Water saw their investment go from £5bn to zero in a few months — they were blindsided by bad models and bad data… 

There is a better way. Applied financial research and data availability about private investments have made significant progress since CAPM was developed in the 1960s. It is time for investors in private companies like Thames Water to take a more scientific view of asset pricing. They need proper measures of risk for the private asset classes to which they now allocate large amounts, and of the value of the assets they hold.

The point that Blanc-Brude makes is very important. The reluctance of the market to use empirical evidence on important decisions like valuation, especially given the stakes involved, is baffling. There’s such a rich repository of data about infrastructure projects from across the world that it must be possible to look at the realised outcomes from projects across different segments of the sector and make informed, evidence-based assumptions of cost of capital, returns on equity etc. Why use theoretical models with limited practical relevance when there’s good historical data available?

A thing that has intrigued me is why alternative investment funds (AIFs), which typically chase high-risk and high-return investment options, find infrastructure as an attractive asset class. Infrastructure is mostly regulated and therefore comes with low but stable returns but for a long tenor. It’s for this reason that traditionally pension funds and insurers, which look at very long investment horizons, find infrastructure an ideal investment option. Its stable returns and long-tenor are high value for them. 

For fund managers in AIFs like private equity, the infrastructure sector’s attractions can therefore come only from the perspective of asset diversification and not returns maximisation. But this is theory. In reality, private equity investors who are now piling into infrastructure feel that they can make high returns from infrastructure. They see Macquarie’s track record of extracting high returns from infrastructure, none more high-profile than Thames Water itself, as evidence. 

But, as I have blogged and written extensively over the years, these returns can come only at the cost of the project itself. It can come only from asset stripping by loading the company with debt, paying out large dividends, skimping investments, not paying employees pension funds, and so on. The shorter cycle of a PE investment compared to the life cycle of an infrastructure asset means that PE investors can strip assets from the project entity. This is especially true in the case of assets that are newly concessioned out or privatised - the first set of PE investors have a strong perverse incentive to squeeze the balance sheet of the project entity, pay themselves handsome dividends, and exit. Even if they don’t exit and get stripped of their equity after a few years, they would have made enough for themselves and their investors. 

Fundamentally, as I blogged here, infrastructure finance 3.0, which PE kind of investors represent, is about separating ownership from the operations and the life cycle of the asset. Ownership gets parcelled into tranches and is transferred from investor to investor. There’s limited skin in the game for these investors in the asset’s long-term prospects. They are concerned only about the asset being a going concern till they are around and can find another investor who too would have similar incentives. 

There are two big losers in such situations. One, creditors to infrastructure assets owned by PE firms (who indulge in such asset stripping) can be left holding a bankrupt entity and are forced to take large haircuts. Two, given the monopoly provider of an essential service nature of such assets, governments cannot allow these assets to fall into liquidation. They will have to step in to facilitate restructuring and find new owners who can operate the asset or take it over and run itself. In either case, taxpayers are on the hook. 

Truth be told, PE investments in infrastructure are mainly aimed at segments like data centres, telecommunications, and natural gas where there are enough opportunities for higher returns. 

Three takeaways from this. One, policymakers should be careful about what they wish when they court private investors like AIF in infrastructure sectors. There’s a strong case for designing bid documents that are explicit about the expectations of investors from such investments. Bid documents should pre-empt asset-stripping possibilities by mandating clear, salient, strict, and public disclosures of relevant information. Two, regulators must be vigilant in monitoring PE (and any other private) investments in infrastructure sectors for the various asset-stripping practices. Three, creditors should have supervisory mechanisms to watch the emerging financials of their borrowers.